In software project management, the Agile approach, known as an iterative, incremental, and highly flexible method, has grown steadily in popularity over the past decade.

These days, we often associate Agile software development with sprints, standups, and burndown charts, but those aren’t the only things you can use to assess your team’s success or failure. In this regard, you should be aware and know how to use the most effective Agile metrics to choose the most accurate methodology.
With metrics in Agile, you can evaluate the success of your software development process and the level of cooperation between the developers.
That’s why from our list of 15 Agile metrics, each one will be useful to both in-house and Agile-dedicated teams in measuring software quality, productivity, and performance.
Our aim is to provide you with a complex understanding of what Scrum, Kanban, and Lean metrics in Agile are, why they are important, and which type you can choose for your particular software development project.
What Are Agile Metrics?
Metrics in Agile are the measurements related to Agile software development and typically include data from various points along a software project cycle. They can be used to monitor performance and inform your decisions about processes and products as your team moves forward in building software.
Since a metric is a way to measure progress toward a goal, Agile metrics are among the key performance indicators to measure progress and health in an Agile software development environment.
Precisely, Scrum, Kanban, and Lean metrics help software teams monitor productivity across workflow stages, access software quality, introduce more clarity to the development process, and help a Scrum/Kanban master keep track of their teams’ well-being.
Why Are They Important?
The main contributions of Agile metrics to the Agile software project cycle refer to the quality of decision-making, predictability of the workflow, and the presence of Agile KPIs to measure performance.
You Can Make Informed Decisions
Agile metrics are an important component of successful Agile development because they help project managers, Scrum masters, product owners, and everyone involved in a project use data to make informed decisions about where to go next.
These data-based decision-making practices make Agile so different from other software development methodologies such as Waterfall, which relies on meetings and documentation rather than data to make progress.
You Get a Project Plan
Based on the chosen Agile metrics, you can develop a project plan that sets specific goals for each sprint, so that you can accurately track how well your team is doing.
Once deviations appear, you will detect them on time and make necessary changes for moving forward as planned. This will keep your team on task, which will lead to better results as a whole.
You Work with Measurable Agile KPIs
Key Performance Indicators (KPIs) are essential for measuring a project’s status, determining if adjustments need to be made, and answering questions about cost, delivery time, and success. In Agile workflows, such KPIs help to set benchmarks and determine how well a team is functioning over time.
What Are the Main Types of Agile Metrics?
- Scrum metrics. The most commonly used metrics in software development that focus on improving team collaboration through learning from experience, self-organization, and continuously improving together.
- Kanban metrics. An Agile software development framework that is similar to the Scrum methodology but presents the essential information for teamwork enhancement on a Kanban board.
- Lean metrics. The set of Lean metrics helps to detect and remove project activities that bring no value in terms of overall performance and result effectiveness.
15 Most Popular Agile Metrics
Depending on the expected result and the particular area of application, you can choose among these 15 Agile metrics to get the necessary boost in your project performance.

1. Sprint Burndown
Type: Scrum metrics
Application: Tracking progress time on completing tasks within a sprint
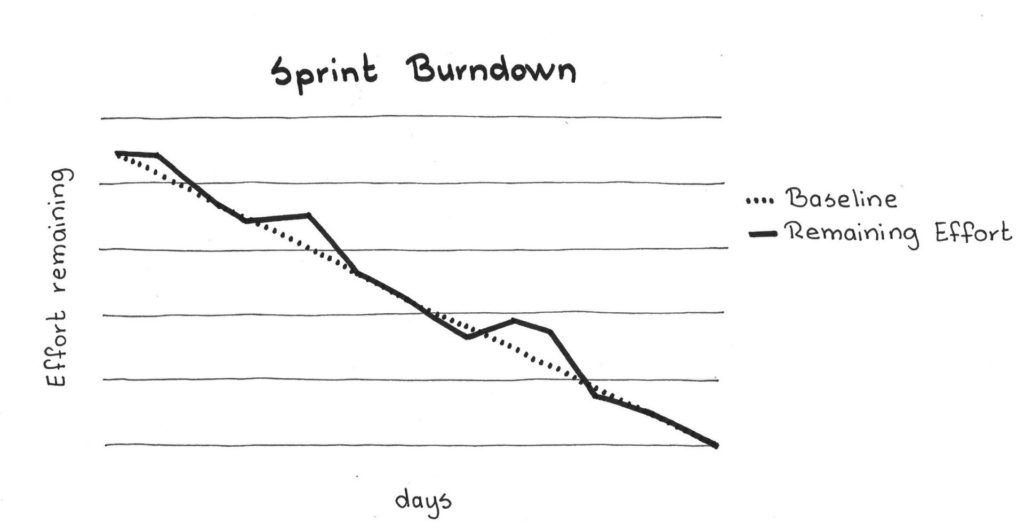
Sprint Burndown is an Agile measurement of two main parameters of project performance: time in story points and the work left. A chart with X- and Y-axes visualizes the project progress as a line drawn from upper left to bottom right, so you can immediately see whether the actual project progress follows the planned one. This way, you can provide the necessary changes in each sprint in real-time.
Accurate planning is a key to success while working with Sprint Burndown. Before starting a sprint, a team forecasts how many story points they can complete in its course.
Then, an assigned Scrum/Kanban master will track the completion of those story points and ensure a team will finish the planned scope of work within the set time frame.
2. Epic and Release Burndown
Type: Agile metrics
Application: Tracking the bigger picture of the work progress
By relying on epics as larger units during the project progress, these Agile metrics allow teams to track bigger bodies of work than Sprint Burndown can cover.
One of the major benefits of Epic Burndown and Release Burndown is that they help manage the scope creep — the addition of new requirements after the project scope was already defined. This way, you ensure your team will not lose in productivity after, for example, the product owner on the client’s side tasks your team to add a new massive feature.
3. Throughput
Type: Kanban and Scrum metrics
Application: Measuring the number of tasks delivered per sprint
This metric helps to determine the number of tasks delivered during the sprint, which helps in planning iterations and predicting team performance during the project. At the same time, its measurement is limited by an inability to see the starting point.

4. Agile Velocity
Type: Agile metrics
Application: Forecasting project performance based on the average amount of work covered during a sprint
For product owners, Velocity is one of the most essential metrics in Agile software development to quickly evaluate future project progress. It becomes possible by seeing the average quantity of completed story points over several past sprints in the backlog.
You can use the metric to foresee how effective your team will be in the forthcoming sprints, especially if you have enough information from the past to rely on.
Other benefits of Velocity include the presence of measurable Agile KPIs and the ability to see a clear result and possible sprint inefficiencies right away. In general, following how your team’s Velocity changes over time helps to keep track of project productivity.

5. Cumulative Flow
Type: Lean metrics, Kanban metrics
Application: Seeing the distribution of issues during the whole project length
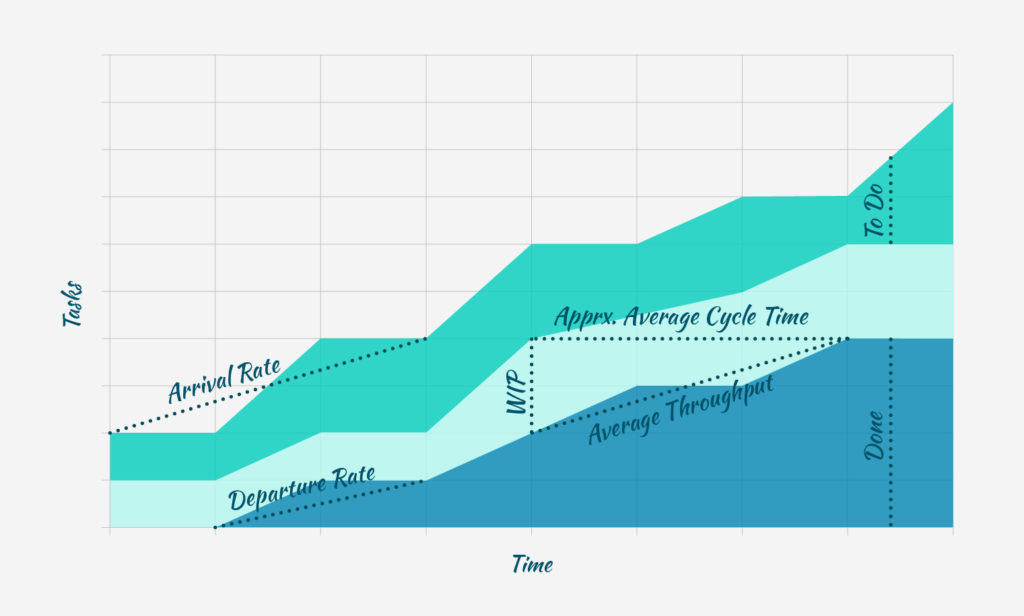
Cumulative Flow gives you a bird’s-eye view of the status of your tasks in a sprint, release, and across software teams. With this metric, you will be able to view all statuses for all workflow stages and immediately identify bottlenecks — all in a single diagram.
This is possible with the accurate representation of all the issues on the Y-axis, with the X-axis dedicated to time. In this visualization, ideal project progress is smooth from left to right, and any narrowing and widening demonstrate problems with project planning and potential difficulties for the team.
This way, the Lean metrics provide actionable information on your development processes, helping your team to avoid issues both big and small.
6. Code Coverage
Type: Agile metrics
Application: Measuring the percentage of code ready for testing
Code Coverage will help you calculate how much of your product’s code is covered by unit tests, presenting it in a raw visualization.
It can be measured by the number of methods, conditions, statements, and branches that comprise your unit testing suite. You can also run Code Coverage automatically as part of every build.
While Code Coverage is one of the most effective Agile metrics, it does not measure the input of other types of testing. So, if your numbers are high, it doesn’t necessarily mean your product has solid code. Still, the metrics will give you a good perspective on the quality of your product.
7. Escaped Defects
Type: Lean metrics
Application: Identify bugs in a release
Escaped Defects will help you identify the number of bugs in a build or release after it enters production. This metric allows your team to access the quality of your software, although in a rather raw form. This is one of the Agile quality metrics you should consider using, as bugs on production always pose problems. At the same time, it’s not an independent metric but is best used as a foundation for additional measurements.
8. Failed Deployments
Type: Lean metrics
Application: Get the number of overall deployments
This metric will help you access the number of deployments to testing and production environments. Failed Deployments can shed light on how reliable those environments are and whether a team is building working software at all. Concurrently, you can use these Lean metrics to understand whether a given sprint or release is ready to go to production.
This metric can be used as a supporting data point when you analyze your other metrics, such as Velocity and Lead Time to see if anything has been slipping or being rushed through to production.

9. Release Net Promoter Score (NPS)
Type: Agile metrics
Application: Measuring the number of users ready to recommend a product or service
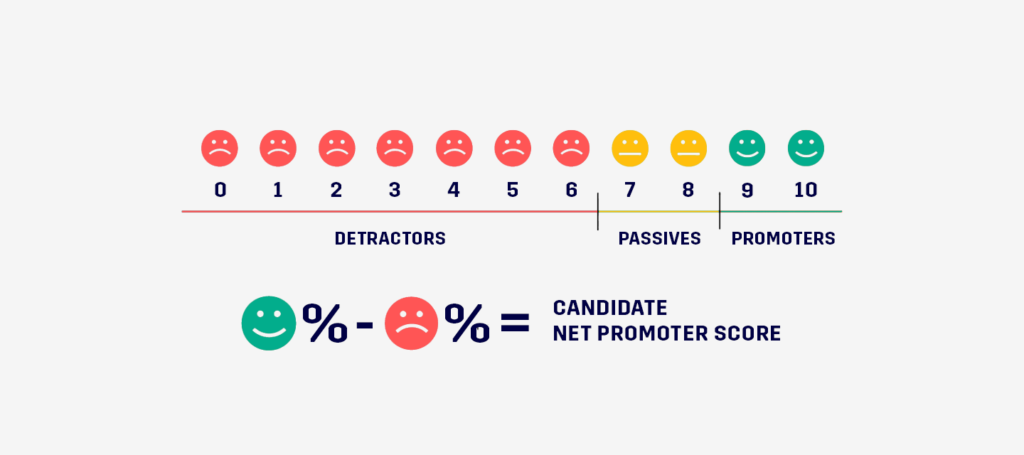
In essence, Net Promoter Score (NPS) is not only an Agile software quality metric but also a customer satisfaction metric. Being measured right before the release, the metric demonstrates the reaction of users to a given release. The metric can help teams predict whether users will recommend the software product.
NPS gets distribution by ranging the answers to the question similar to, “How likely are you to recommend our product to a friend or colleague?”. The responses will fall into three groups: Promoters (those who answer 9 or 10), Passives (those who answer 7 or 8), and Detractors (those who answer 0-6). The ratio of promoters over detractors is equal to NPS.
10. Control Chart
Type: Agile project management metrics
Application:
Control charts, also known as run charts, are created to visually track a specific variable (or variable group) over time. The goal is to monitor these trends and find patterns, especially when it comes to detecting potential shifts in distributions.
In Agile software development, the application of a control chart is to track the transition of tasks from “in progress” to “done.” For this, the metric uses the Y-axis to detect the time elapsed on every single task and, in this way, ensure predictable delivery.
The main idea of tracking tasks with a control chart is that every new data point is compared with all previous data points. If everything fits in a normal distribution, then we expect to see most points around a central line.

11. Lead Time
Type: Lean metrics
Application: Evaluating project performance as the whole
Frequently compared with Cycle time, Lead Time helps the team to predict how long the work will take in their workflows in a similar manner. Nevertheless, this metric picks the total project time as the Agile KPI, without splitting it into smaller cycles. This way, you can get a broader picture you the project’s progress from idea to realization.
At the same time, in the case of delays and slow processing time, it’s better to supplement the Lead Time metric with Cycle Time to get more accurate insights.
12. Value Delivered
Type: Agile
Application: Evaluating the value of each requirement
This metric traces the actual value delivery within the project, by setting the development of the most valuable features at the top of the priority list.
Once visualized, a good graph will grow upward from left to the right, with a simultaneous decrease in the risk line. With its help, the product owner, focusing mainly on increasing ROI and cutting costs and risks, can take a pragmatic stance when faced with requests for additional resources.
13. Work Item Age
Type: Agile
Application: Visualizes how much time passed from the start to the completion of a project
The metric shows the aging work in progress, meaning how much time your team has already spent on each given task. This way, it’s easy to evaluate the current state of the project performance and evaluate its pace and success in comparison to the previous project at a similar stage.
Aging work-in-progress is shown on a timeline, which visually breaks down what your team has been working on and for how long. Each status is marked in color, where red is for overdue tasks that have exceeded their estimate, yellow is for tasks in progress, and green is for completed tasks.

14. Quality Intelligence
Type: Agile
Application: Shows the recent code changes
The metric ensures the maintenance of software quality by keeping track of all the updates in the code taking place. Also, its methodology can be applied to evaluating the skills and performance of each team member, although this analysis is not common yet. In this broad sense, Quality Intelligence helps to detect accurate metrics and KPIs when project circumstances change.
15. Static Code Analysis
Type: Agile
Application: Evaluate the source code in terms of security
Static Code Analysis works with the source code to detect potential vulnerabilities, bugs, and safety threats. With this metric, you can automate Agile software development, letting your QA specialists create test cases early in the process by using helpful algorithms and getting fast feedback.

Hire an Agile Team for Your Software Development Project
If you’re in search of an Agile team, refer to Intellectsoft! With decades of experience, we deliver various software development services and always adjust the delivery approach based on your business limitations and requirements.
Talk to our team now and let’s determine the exact Agile KPIs for you to measure our project success!
